
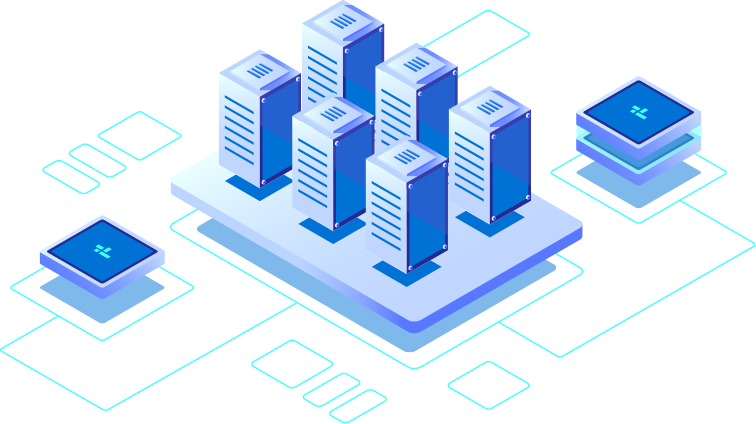
The machine-to-anything gateway solves the problem of integrating different IoT devices into a single platform. We have developed this proprietary technology to handle a large number of concurrent device connections at a very high speed, ultimately making our FAMS Mobility Platform hardware-agnostic.
We support various deployment modes, either as SaaS (Software-as-a-Service) on our custom cloud hosted in German data centers, on your private cloud or your own data center, so you can meet your strict business requirements and regulatory compliance.
We embrace open source and believe it’s the main innovation accelerator of the modern tech-world. We use open source technologies and platforms like Linux, Apache, MySql, Redis, PostgreSql, MongoDB, PHP, NodeJS, and many others.
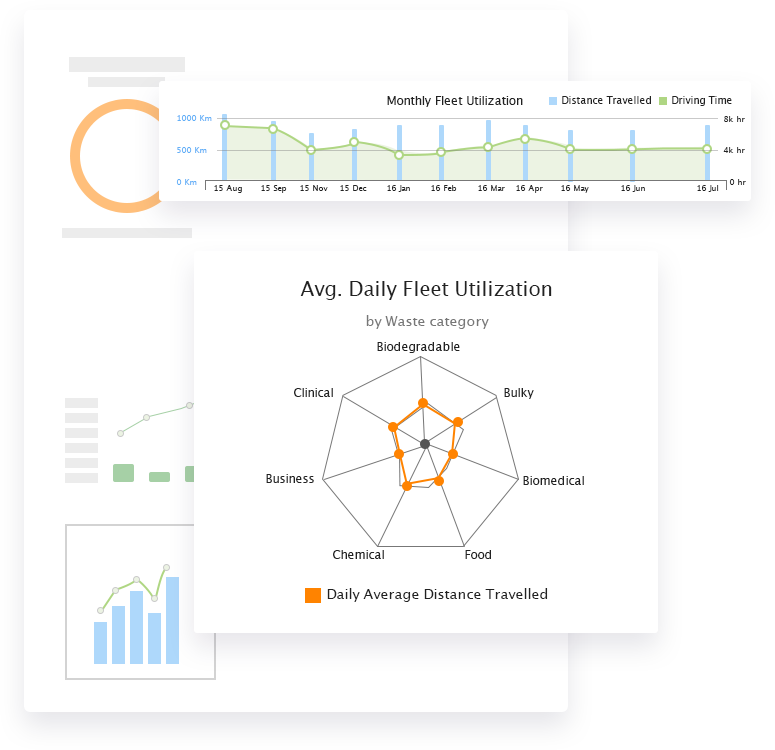
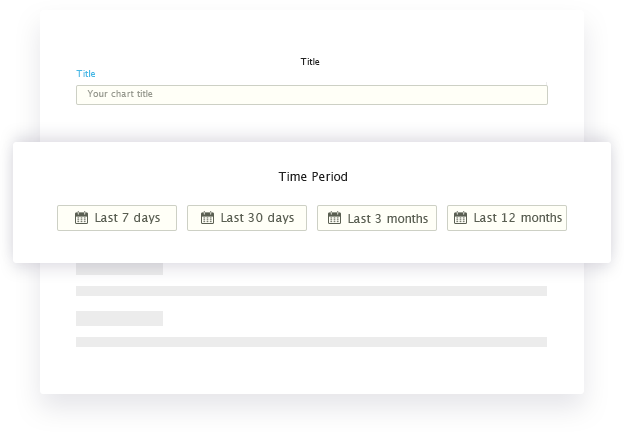
Visualize the performance of your fleet and mobile workforce, in customizable
interactive graphs over days, weeks, months, or years.
Explore your data sets, visualize trends and patterns, build professional dashboards and dig deep into your data using the most intuitive user interface in the market. Whatever your requirement is, our solution provides you with a unique working-data experience.
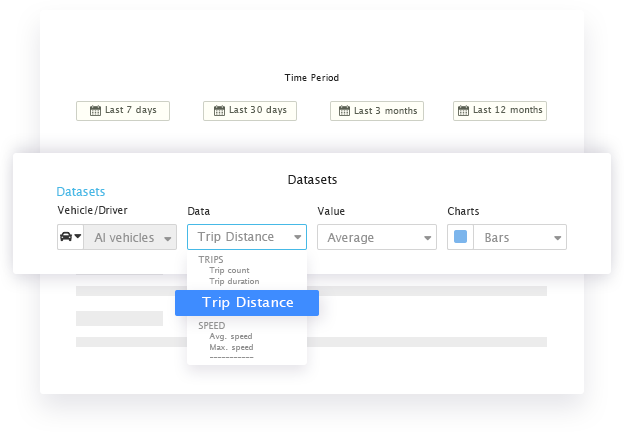
Users can create their own interactive charts and graphs, visualizing data of days, weeks, months, or years, being displayed in user-friendly dashboard style views. Besides adding, updating, or deleting charts, the users can easily resize and rearrange them as per their analytical requirements.
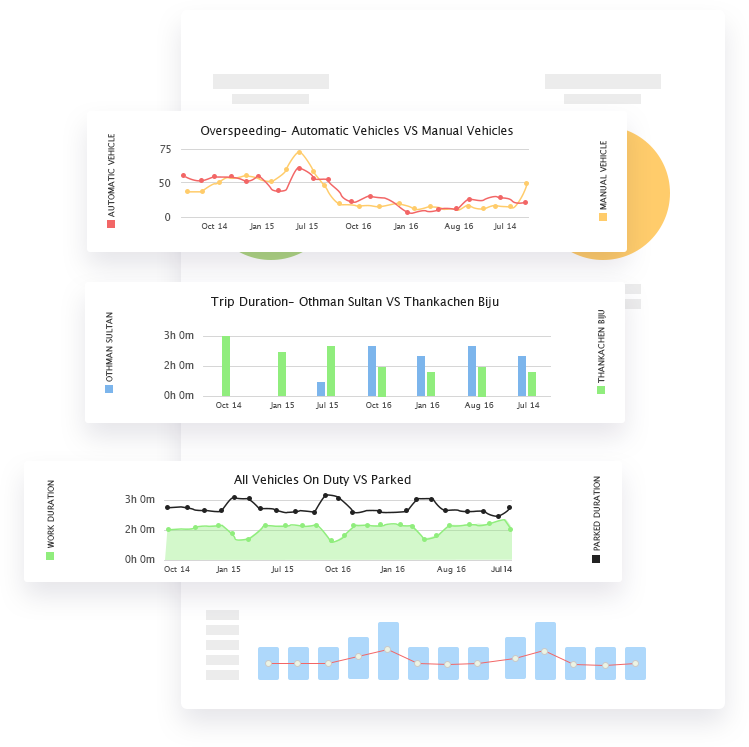
Our proprietary big data engine processes and plots years of data within seconds.
The interface previews the output of your selected data without saving it, which allows you to quickly find the insights you are looking for.
The user can select different chart types to each dataset, giving him flexibility to visualize it in an easy fashion: lines, bars, pie-charts, and more.
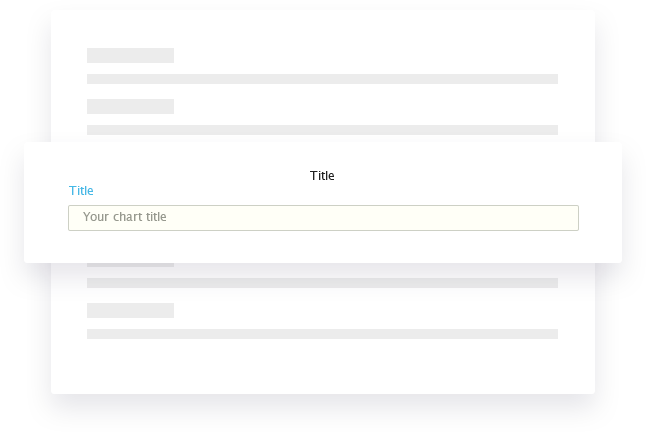
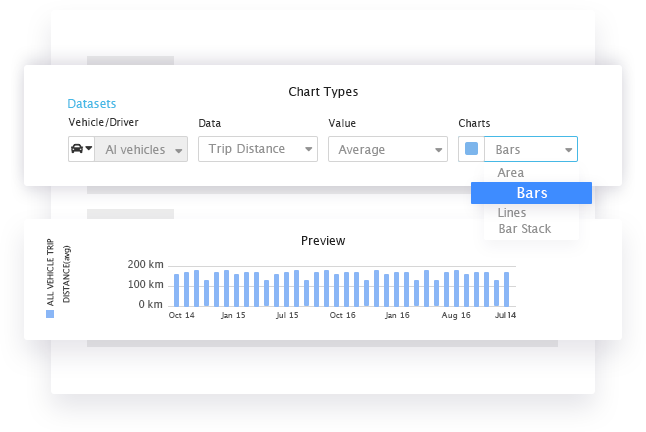
The interface previews the output of your selected data without saving it, which allows you to quickly find the insights you are looking for.
Select different chart types to each dataset, giving you flexibility to visualize it easily: lines, bars, pie-charts, and more.

